Market Update: Thursday, February 13, 2025
We did it! PPI inflation data also comes in hotter than expected, but the market shrugs it off and makes its first push above its recent downtrend
Disclaimer: These are my learnings and opinions only, not financial advice. If you are newer to trading, please read my Getting Started guide to understand the terminology and tools I use. You can also follow me on X where I share some of my trades in real-time.
Market in Review

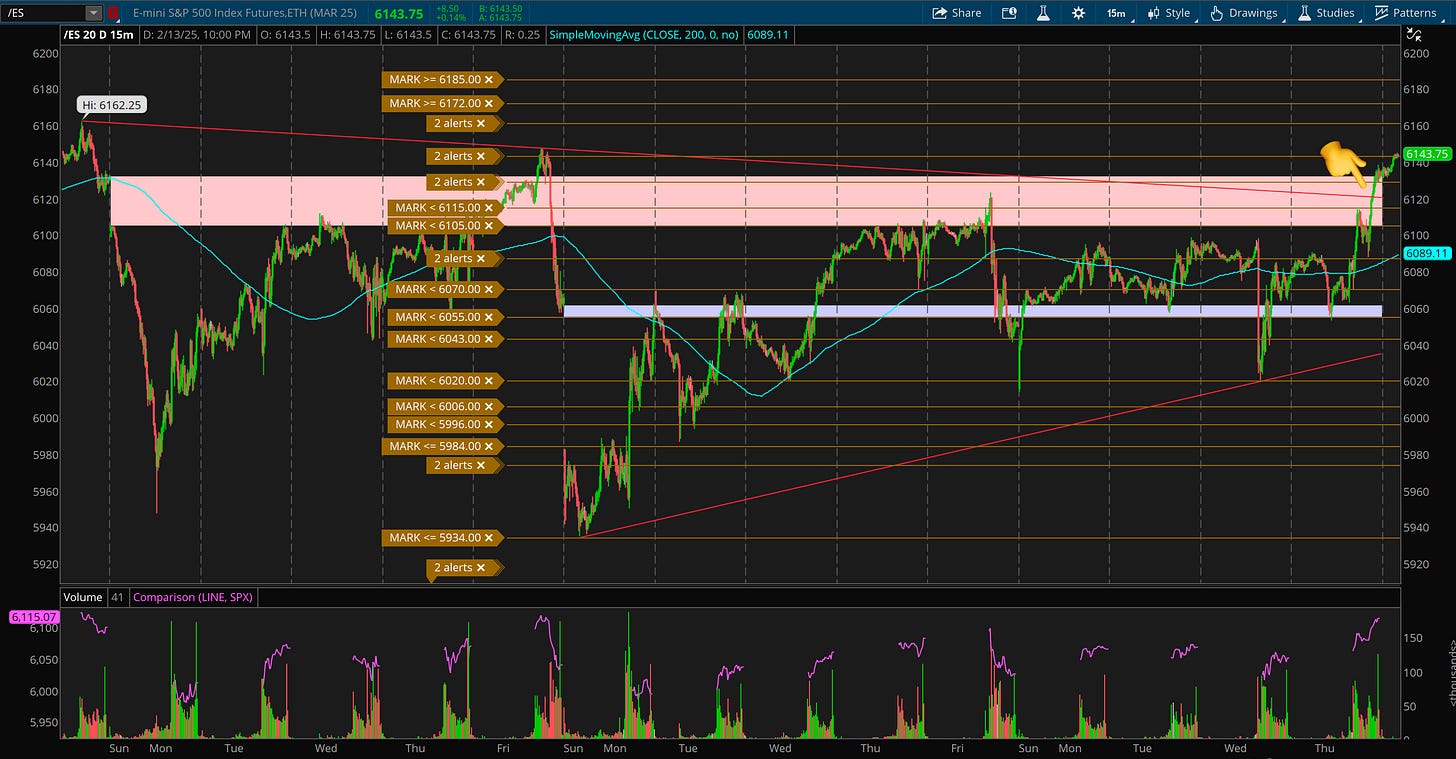
SPX/ES: Last night, /ES started dripping lower — the red-hot China markets were initially green but closed red so that might have caused /ES to pull in — and by early morning, /ES was back down at the 50SMA (6053 near the blue zone above). We bounced to ~6070 — an area we’ve tested a ton this week — and hung around there until 8:30am ET when the PPI and jobless claims data were released.
Jobless claims were “Goldilocks” like we wanted, but PPI showed inflation still affecting wholesale prices, but slightly easing from December’s upwardly revised levels. Headline PPI rose 0.4% (above expectations), but core PPI met forecasts at 0.3%. Despite the hotter-than-expected headline reading, key components tied to PCE inflation mostly declined, suggesting it may not lead to a significantly higher PCE report. We’ll know for sure on February 28 at 8:30am ET.
PCE (Personal Consumption Expenditures) inflation measures the average price changes consumers pay for goods and services, making it the Fed’s preferred inflation gauge. It’s considered more accurate than CPI because it adjusts for changes in spending habits and covers a broader range of expenses.
/ES quickly spiked on this PPI data to 6087, reclaiming the 8/20/50MAs and back above the 200SMA on the 15min chart (light blue line above) which is my intraday bull/bear line (bullish above it, bearish below it). The only thing that had me pause from going full-tilt bull mode was that Trump announced that he’d be doing a presser at 1pm ET on guess what topic? Nope, not plastic straws — tariffs!
/ES continued to push higher through the day, and I was watching to see if it could 1) enter the pink zone above (the DeepSeek gap down), and 2) push with some gusto above the yellow-dotted line below, which is a trendline all the way from the high on Friday, January 24 before we gapped down the following Sunday on the DeepSeek fear.
This trendline was forming the pennant I talked about, and we had been coiling inside that pennant for the last three weeks.
As you can see, this looked like a bullish pennant, but I wanted to see it actually play out — and damn, did it ever. We are now sitting above the pink zone around 6143.
Keep reading with a 7-day free trial
Subscribe to The Liquid Update to keep reading this post and get 7 days of free access to the full post archives.


